Week Grid Reports
(![]() NEW) Week Grid reports display facility occupancy data across the hours of the day and the days of the week, providing detailed information on occupancy over time.
NEW) Week Grid reports display facility occupancy data across the hours of the day and the days of the week, providing detailed information on occupancy over time.
Select Report > Week Grid from the menu.
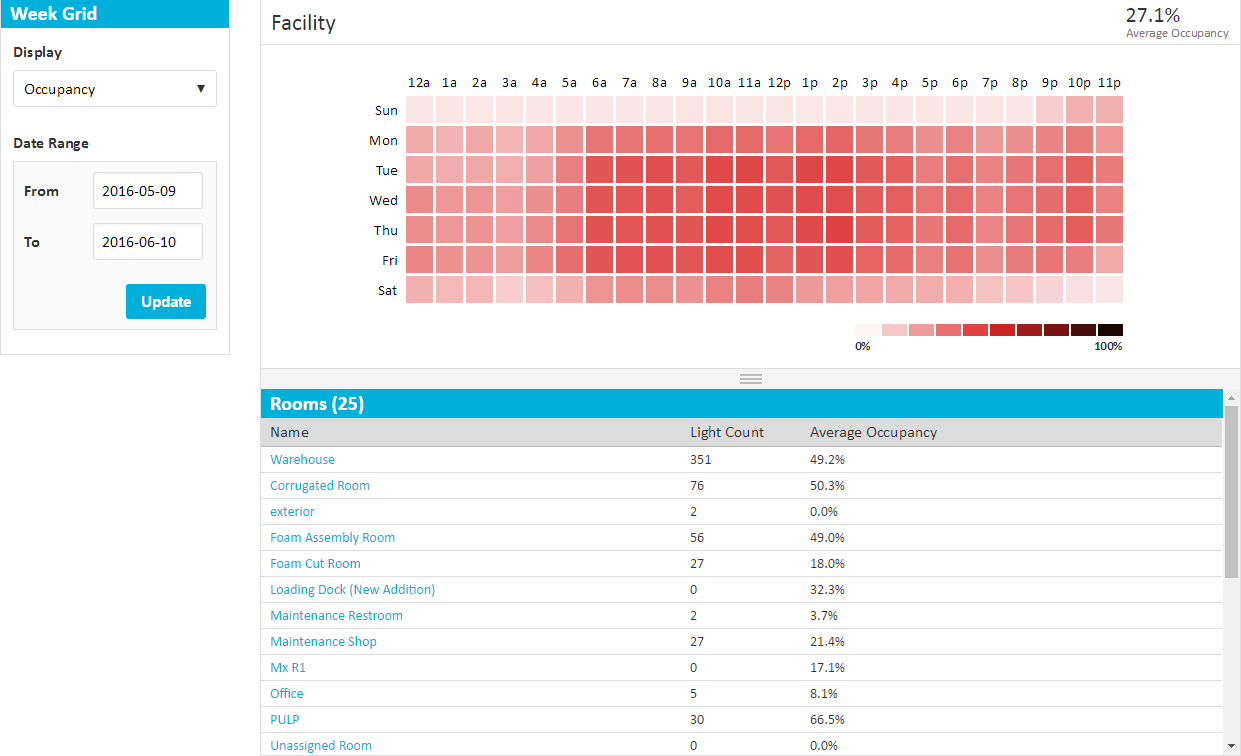
The week grid report shows data for the entire facility, with automatically selected parameters. Customize the report by altering the following:
- Display: Select Occupancy, Active Percentage, Energy Usage, or Energy Cost.
- Date Range: Enter a custom date range and click Update.
- Select Report > Week Grid from the menu.
- Select a room from the list below the chart.
LightRules auto-refreshes the results, displaying data for the selected room and providing a list of zones below the chart. - Select a zone from the list below the chart.
LightRules auto-refreshes the results, displaying data for the selected zone and providing a list of lights below the chart.
- Facility managers can use the week grid to identify downtime during which they can schedule maintenance.
- The week grid can also be used to ensure security by showing activity outside of operating hours. This helps you understand when people are traveling to certain areas of the facility or retail space.
- Hover over a time interval in the week grid to display data for that interval.
- Hovering on the grid provides exact occupancy at that time while the number in the top right hand corner provides an average for the space over the chosen date range.
- Hover over a room /zone/ light in the list below the week grid to filter results for the selected item.
-
To enable energy cost reporting, an Administrator first needs to enter a flat rate energy cost. See the Reporting Metrics section in Reports Overview for more information.
-
LightRules reports have unique URLs that let you bookmark and share customized reports links. Copy and paste the URL to share with coworkers, or bookmark the link using your browser's guidelines.