LIGHTRULES 3.0 > LightRules Dashboard
LightRules Dashboard
(![]() NEW) Following login, the LightRules dashboard appears, providing at-a-glance reporting, energy usage information, and instant access to manual light control. The new 3.0 dashboard is redesigned to provide a detailed, insightful view of the facility:
NEW) Following login, the LightRules dashboard appears, providing at-a-glance reporting, energy usage information, and instant access to manual light control. The new 3.0 dashboard is redesigned to provide a detailed, insightful view of the facility:
|
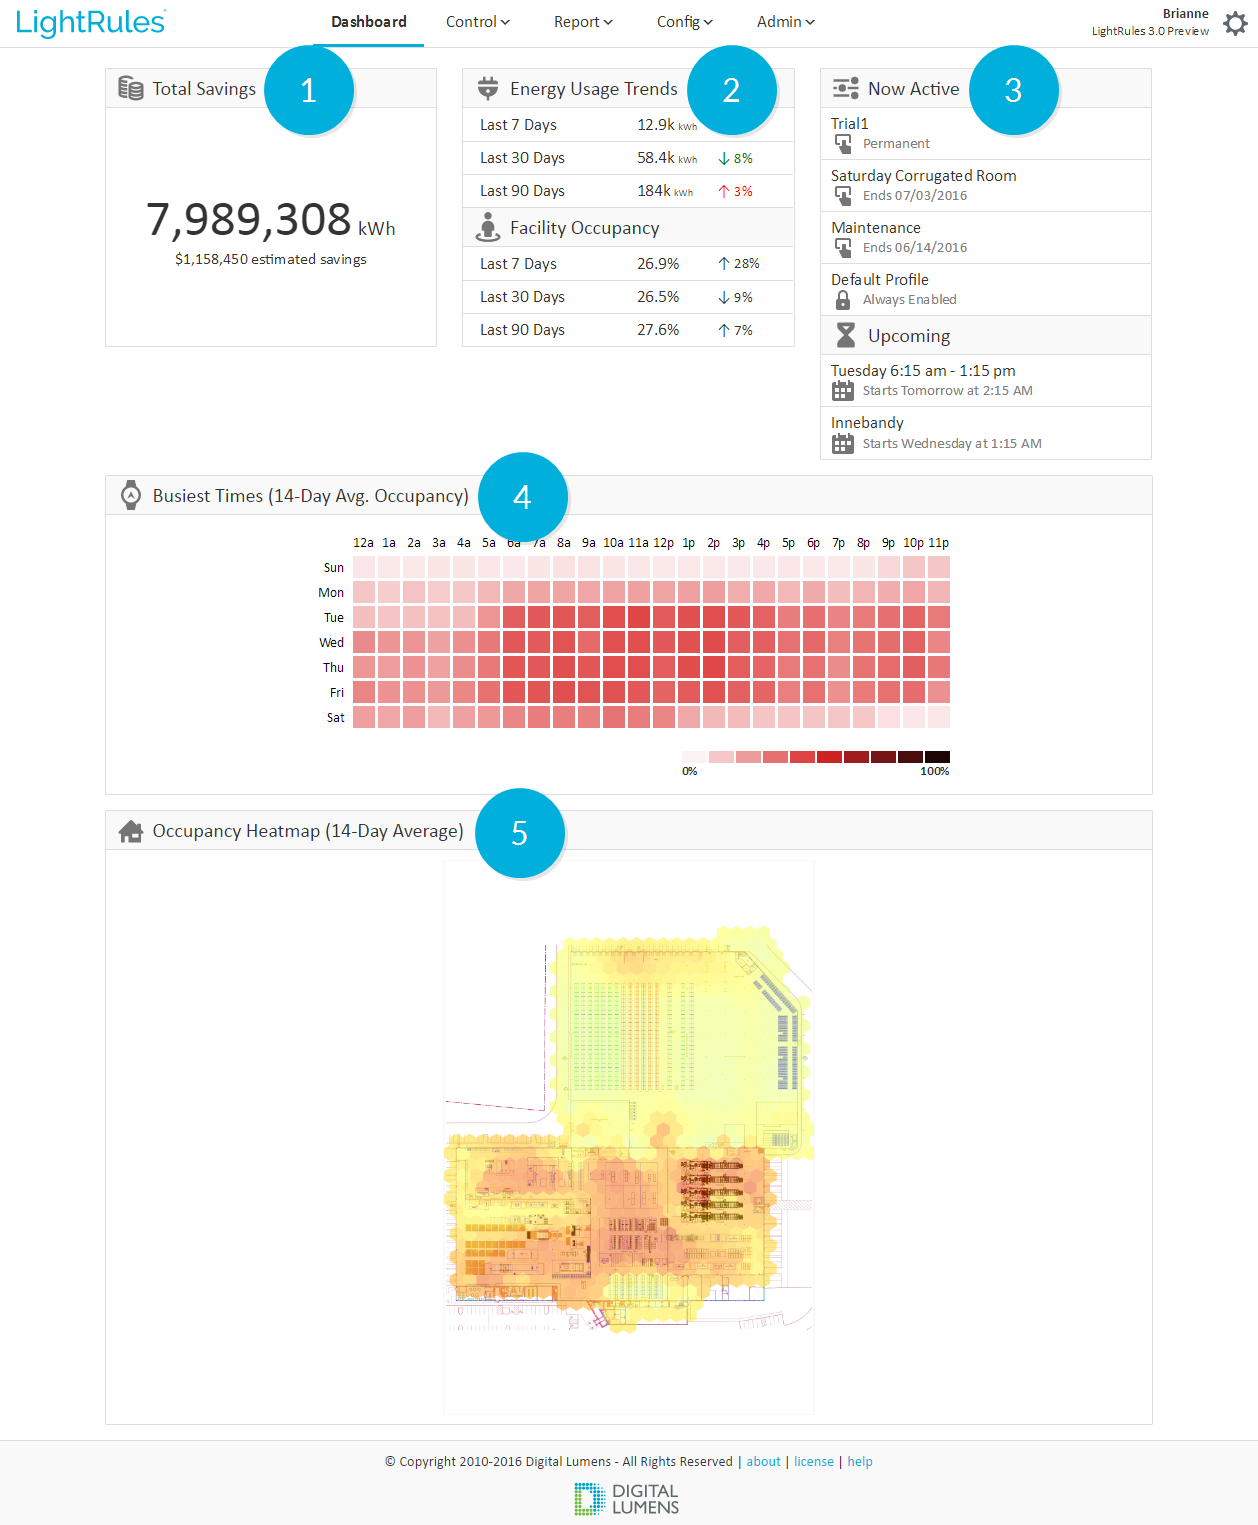
1.  |
The Total Savings widget lets you see how much your lighting system has saved you since installation. Click the number to view the LightRules Savings line chart. For more information on total savings, see Chart Reports . |
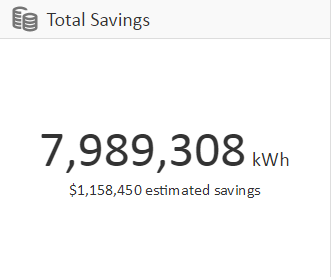
2.  |
The Trends widget shows you energy usage trends and facility occupancy data. Hover over the up/down arrows to see the percent change over 7, 30 or 90 days. CLick the energy amount or percentage to view the line chart. For more information, see Chart Reports . | |
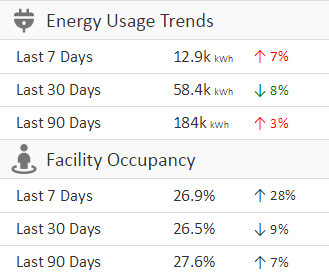
3.  |
The Active Profiles widget displays active and upcoming profiles throughout your facility. You can cancel profiles from here by hovering over the profile and selecting the gray "X." For more information, see Manual Control. | |
4. 
|
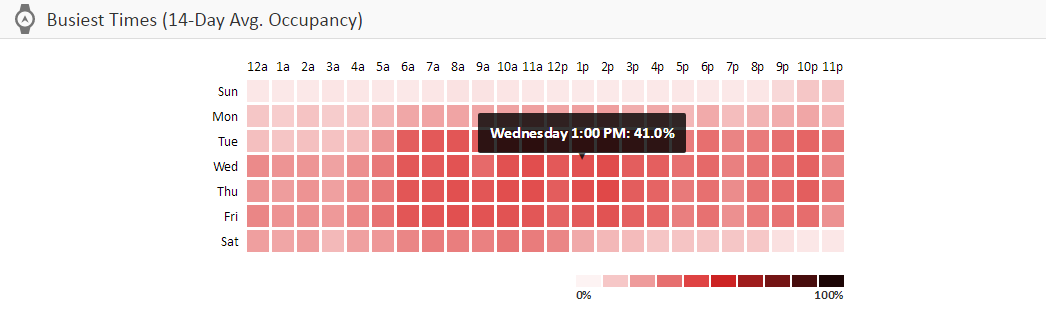
The Busiest Times grid lets you see average occupancy over the past 14 days. For more information, see Week Grid Reports. | |
5. 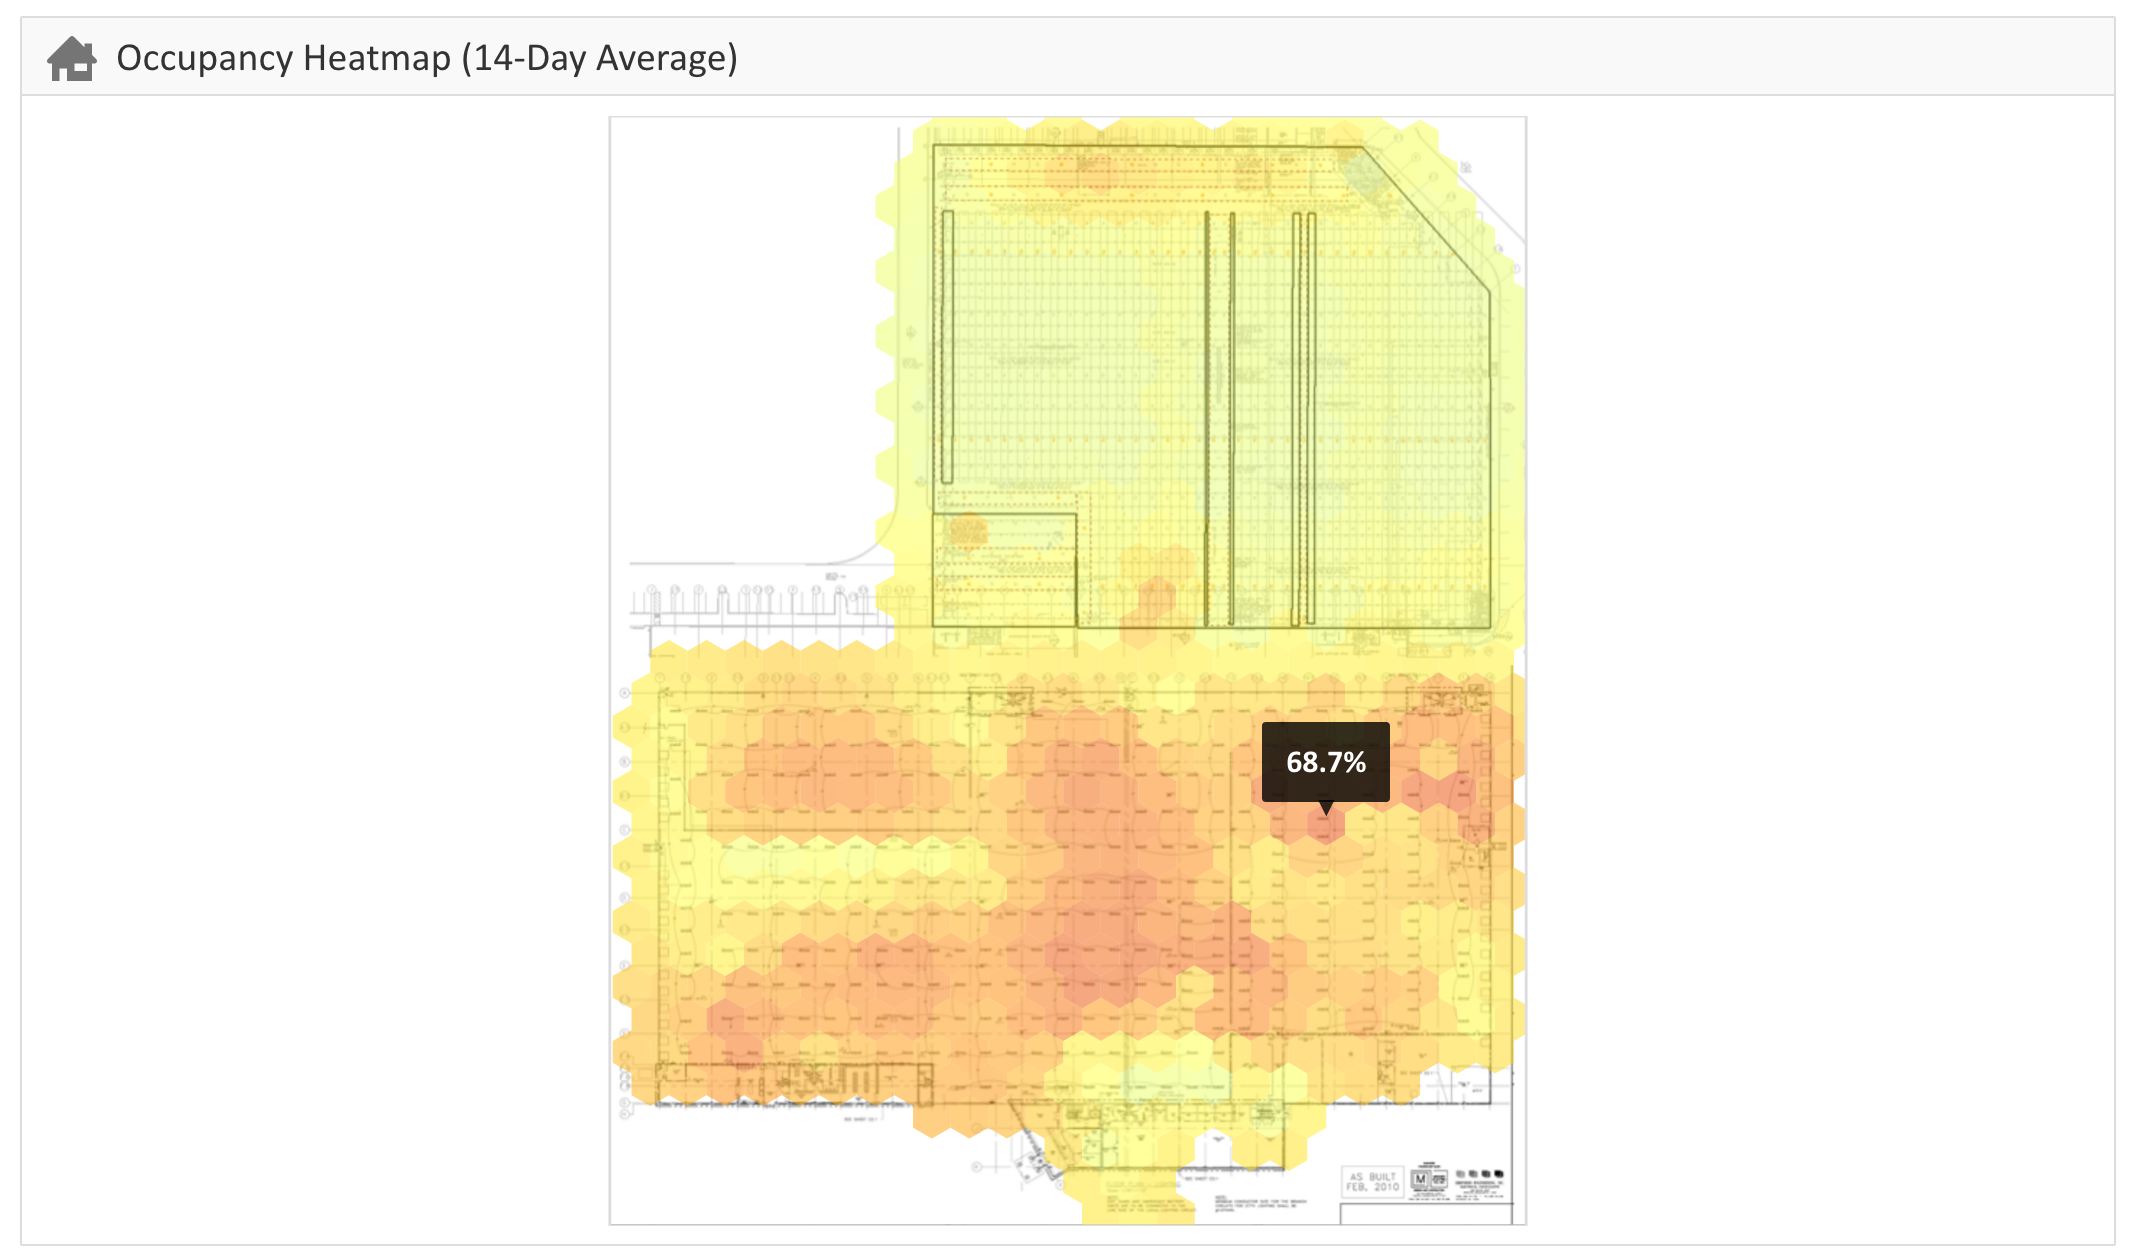 |
The Occupancy Heatmap lets you visualize where you facility is busiest over a 14-day average. For more information, see Heatmap Reports . |